|
|
|
|
2007 GIS Competition: Montana Fires in Relation to Precipitation and Temperatures (Jessica, Ian, & Jessica)
The map that our group has created represents what we predict will happen in Montana in 2050. Temperatures are rising due to global climate change and we can see these changes already occurring from 1950 to 2000. Respectively this affects how we are having longer, drier summers, leading to harsher fire seasons.
The data that our map consists of are temperature averages, precipitation values and forest fire square acreage. When making our map we used the hyper-linking tool to add pictures to various sites on the map to give the viewers actual photo images to look at. We also used the attributes tables and the layer properties, especially the symbology tab, used to show the 1950, 2000, and 2050 projected temperatures. Within the symbology tab we used several different tools. We were able to color coordinate the projected temperatures and years, as well as graduate the shapes which showed the difference in temperature around Montana.
From this we can predict that the future for Montana will be hotter and drier than we have seen in the past. Fire seasons will be longer and harsher due to the increased temperatures and less precipitation. The question now is what can we do to ensure the safety of our communities. Environmentally we will have to be so much more careful than we are today. Logging and forest operations will have to be more heavily watched. Local community members will have to take charge and recognize the changes in the environment, using BMP’s on personal property as well as public. Farmers can watch how much they irrigate and when they do it. Watching the water levels will be very important when in a time of drought.
Bibliography
Fire History Region 1 (1985-2005)
www.spatialsci.com
MT Climate Trends
www.spatialsci.com
MT Annual Precipitation
www.spatialsci.com
|
|
|
2007 GIS Competition: Climate Change Impacts on Ski Resorts (Meghan, Nathan, & Allison)
The impacts of global warming are becoming more prominent each decade. Since 1950, some serious signs of global warming have become evident. Locally, we have seen dryer summers, milder winters, more intense fire seasons, and less snow pack. If this trend continues at the current rate it will cause major repercussions in the future.
The diminishing snow pack could hit hard on the winter recreation industry in Montana. Several towns in Montana rely on the ski industry to bring business into the town. If ski hills don’t get enough snow, the towns in the surrounding area may lose business, thus unemployment rates will go up. As the weather warms the snow line will rise. If the ski resorts are not at a higher elevations this could devastate the skiing industry.
Our map gave us a visual of the precipitation levels that we should expect in the future. We can now predict what may happen to our local ski industry. Our map could be used when deciding where to establish future ski resorts, because you can consider projected precipitation patterns.
We need to take the initiative to clean up our environment and lessen our impacts on Earth. By making tougher restrictions on carbon dioxide and other green house gasses, we can try to slow of even reverse the effects global warming.
Our community will be affected in a different way. Less snow pack means less runoff in the spring for growing crops. If our soils are dry the farmers in the area will not be able to grow a large quantity or quality of crops without irrigation.
What will happen when there is no snow pack?
**Geospatial tools that we used to build our map:
Hyperlinking
add data
changed attributes
Layer properties(symbology tools, graduated colors)
**Sources we used to build our map:
Spatialsci data , demography, Physical science, Precip, precip points,
http://www.wintermt.com/dhski.htm
http://www.spacialsci.com/files/images/272,20MARCH SNOW LEVEL AT SNOWBOWL 2005 vs. 2055
|
|
|
2007 GIS Competition: Impacts of Global Warming (Kara & Bethany)
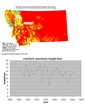
The map that we created shows the average precipitation rate 1961-1991, as well as the height of the Clark Fork River (near Plains) each year 1961-1991. The graph showing the Clark Fork’s yearly height has definitely decreased between these dates. The precipitation average allows you to see what the environmental conditions had been like and how it also affected the Clark Fork.
This could be a definite sign of global warming or simply a prolonged drought, but either way it will have a drastic effect on our local environment if it continues.
Although this bit of data may seem insignificant, take into consideration how other water bodies are faring in Montana under these conditions. The map gives a clear view of the average precipitation level throughout the state. Some of these levels are much lower than that in our area. How far could those river heights have dropped? Our maps purpose is not only to give you the facts about our area, but also generate interest in state-wide conditions.
You can observe through the graphs that there were some jumps in the water level between 1961-1991, but overall there was a decrease. By 2050, if this trend continues, we can predict that the Clark Fork will have decreased by at least another four inches.
We constructed this map using Microsoft Excel and shapefiles from spatialsci.com (Precipitation Averages, Rivers, Lakes, and Streams of Montana, and Cities of Montana). Tools and methods we used ranged from color coding precipitation levels, texting, and turning on and off specific layers.
There was actually a lot more we could have done with the map, but we didn’t realize how many options or opportunities were available to us. This project gave us a broader perspective on the possibilities of Arcmap topography. We have also familiarized ourselves with the tools necessary to make at least a half-decent map.
It was extremely interesting to find the annual height of the Clark Fork river near our town mostly because we could bring the concept of global warming closer to home (literally). It gives us more incentive to address the energy crises facing our country.
Some quick and easy ways to save energy are to buy an energy efficient bulb, which are usually coiled and don’t cost all that much, insulate your home to save on heat bills, use a wood stove rather than a stove ran by fossil fuels, and turning off lights as you leave the room.
You can also save energy through regular household chores: drying clothes on a line instead of in the dryer, washing full loads of dishes and clothes in the machines, not using the electrical dryer on the dishwasher, collecting rain water to water plants and animals, cleaning the lint trap on the clothes dryer regularly if you have to use it, cooking with the lids on pots and pans, wiping moisture from bottles and cartons before putting them in the refrigerator to be sure they do not add to the latent load, and many others.
Always be aware of the energy and resources you may be using. Even the smallest action can have a big impact.
|
|
|
2007 GIS Competition: Montana Precipitation and Climate, and How it Determines the Fire Season (Melody, Breanna, Jennifer)
Our map shows that Montana’s increasing temperature and the decreasing precipitation will cause the fire rate to increase dangerously. The information shown on our map will tell you that over the years Montana have increased in fires as global warming have increased temperature and decreased annual precipitation. In the areas where the temperature has stayed the same or decreased, the precipitation did not change very much. These are the areas where little to no fires have occurred. In the areas where temperature has increase in general, there is less precipitation, which increases the fire danger. The larger fires occurred where little to no precipitation was present. However, there were some fires that did occur in highly precipitated areas. These fires had little or no effect on the environment because the area was generally moist and the fire could not spread.
If we as Montanans could stop polluting the air by using fossil fuels and pesticides and such that contribute to Global Warming than we could help restore our atmosphere then we would be able to keep fire danger down to a minimum.
|
|
|
2007 GIS Competition: Climate Change in Our Community (Austin, Boston, Bryan, Brandon)
We live in an agricultural community so the dryness and the shifting weather makes it hard on our local farmers/ranchers to thrive uniformly. The level of humidity isn’t that important as long as it stays at a reasonable level. Say for crop farmers, they have means of irrigation for their crops, while there may be health problems for ranchers that have cattle. We’re dumping too much CO2 into the atmosphere by the use of cars and other machines that are ran by fossil fuels.
Community Solutions:
There are several things we can do to improve the condition of our atmosphere. We could all use florescent sources of light. We could use different sources of solar energy for things like heat, lighting, and powering appliances. We could incorporate the use of different, more environment friendly fuels, and carpool rides to work and other places.
Description on how spatial data helped:
The spatial data allowed us to create a map on “Arcmap’. The map helped us visually tell what the climate is like in montana, and what it might be like in 2050. Arcmap is a program that allowes you to plot data on a map, which allows you to see the changes, and the current conditions. The solutions are simple, but will not be easy. People will need to use less fossil fuels.
|
|
|
2007 GIS Competition: Climate & Precipitation Change (Tara, Jessica, & Elijah)
What we show on these maps is that global warming is having an affect on what we feel temperature-wise over a period of years, and how this affects our weather. The smallest circles contained in the two outer-circles represent the temperature or precipitation in 1950, respectively. The middle circle represents the temperature or precipitation in 2000. From the given information, we are able to estimate the changes we will see in the year 2050.
Research Findings and Map-related Criteria
Overall, we see most of the places get warmer and lose precipitation, but there are a few exceptions to this rule.
For the temperature map: The green circles (green being the coolest temperature) tend to be more in the middle (showing the coolest temperatures in 1950). The orange or red circles tend to be on the outer and middle circles (showing the temperature increasing as time passes). This shows a positive correlation between time passing and temperature increasing. It also shows the heat levels from eastern Montana creeping into western Montana. We predict that the central areas of eastern Montana will begin to look like western Montana by the year 2050. This affects our community, as we are in western Montana.
For the precipitation map: Blue shows the most precipitation, red in the middle, and the dry orange-yellow shows the most arid areas. For most circles, the coloration goes red, then yellow as time passes. In conjunction with the temperature map, it shows temperature increasing as time passes, and precipitation decreasing. This is good evidence for global warming, and our theory about eastern Montana (mentioned above).
Possible Solutions
Everyone can lessen the consequences that global warming has on our earth, but it will take many years before we are able to halt it completely. We can speed this process by changing our light bulbs to halogen, and making sure to turn off the lights when we aren’t in a room. This will decrease the amount of carbon dioxide released into our atmosphere. Small things like this have a great impact. Instead of running your own gas guzzling car, you could try carpooling, biking, or walking. If more people did this, it would greatly improve the condition of our environment. Another thing on the rise is the use of biofuels. Within a decade, biofuel use should increase by as much as twenty percent. This will help with the car problem, and the overall environment.
Bibliography
http://spatialsci.com/index.php/fuseaction/data.search.htm
MT_state.zip
89.57 KB
Climate.zip
11.97 KB
| |
|
| |
|
|
|